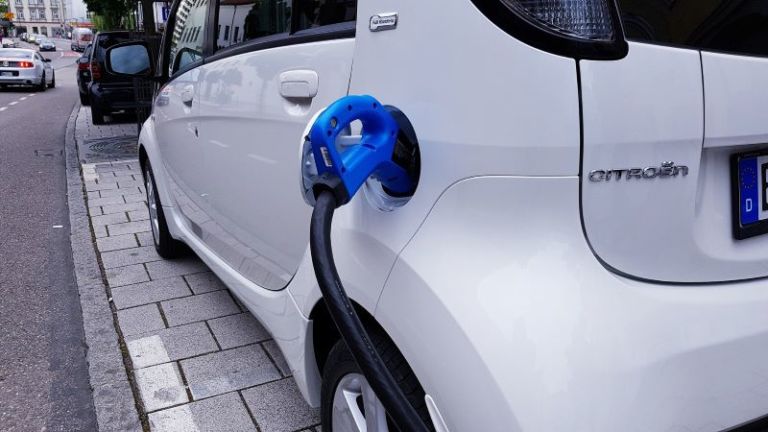
Over 50,000 new e-vehicles in August

In August 2021, 53,400 new electric vehicles were registered, an increase of 61 percent. In the first eight months, new electric vehicle registrations increased by over 150 percent to more than 421,200 units compared to the same period last year. This included 203,040 battery-powered electric cars (up 163 percent) and 218,222 plug-in hybrids (up 154 percent). They accounted for 23 percent of the total market.
Reinhard Zirpel, President of the Association of International Motor Vehicle Manufacturers (VDIK), emphasized: “In August, new cars with electric drives also recorded a strong increase despite the declining overall market. Financial support for purchases through the environmental bonus, an increasingly comprehensive model range and an overall increase in social acceptance of vehicles with electric drives all contribute to this pleasing result.”
The VDIK regularly updates the list of electric vehicles from international manufacturers. The VDIK member companies currently offer around 140 electric models (including passenger cars and commercial vehicles) that customers can order in Germany. The VDIK electric list can be accessed here.
Demand for vehicles with alternative drives as a whole increased in the first eight months. More than 726,000 new electric cars, hybrids with and without plugs, mild hybrids and gas-powered passenger cars were registered. That’s an increase of 112 percent. Some 90,500 new vehicles with alternative powertrains were registered in August (up 42 percent). It should be noted that hybrids include a growing number of mild hybrids that cannot run on full electric power. It is not yet statistically possible to distinguish between full and mild hybrids.
In the overall passenger car market, the balance continues to shift toward alternative drive systems. In the first eight months, they accounted for 40 percent of the total market. Pure gasoline engines accounted for 38 percent and pure diesels for 22 percent.
| August | January-August | |||||
|---|---|---|---|---|---|---|
| +/- (%) | +/- (%) | Share of total car market | ||||
| BEV | 28,860 | 80 | 203,040 | 163 | ||
| PHEV including: |
24,497 | 43 | 218,222 | 154 | ||
| PHEV – Petrol | 22,870 | 46 | 203,215 | 162 | ||
| PHEV – Diesel | 1,627 | 15 | 14,999 | 84 | ||
| FCEV | 38 | 19 | 296 | 47 | ||
| Electric Vehicles (total) | 53,395 | 61 | 421,558 | 158 | 23 | |
| HEV including: |
36,223 | 25 | 296,691 | 72 | ||
| HEV – Petrol | 25,305 | 25 | 191,535 | 69 | ||
| HEV – Diesel | 10,916 | 22 | 105,150 | 80 | ||
| CNG | 199 | -70 | 3,072 | -40 | ||
| LPG | 711 | -8 | 5,315 | 116 | ||
| Alternative Drivetrains (total) | 90,528 | 42 | 726,636 | 112 | 40 | |
| Petrol | 68,598 | -42 | 698,588 | -22 | 38 | |
| Diesel | 34,171 | -51 | 395,322 | -27 | 22 | |