2021 was a record year for alternative drives

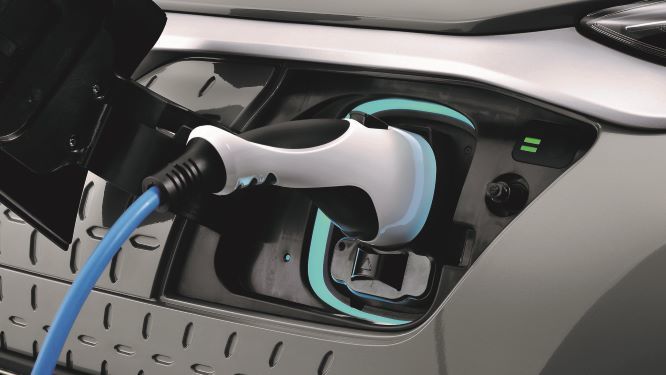
Last year, 681,864 new electric vehicles were registered in Germany. This was an increase of 73 percent. They accounted for 26 percent of the total market, up from 12 percent in the same period of the previous year. New registrations of battery-powered electric cars rose by 83 percent to 355,961. 325,961 new plug-in hybrids also hit the roads (up 62 percent). In addition, there were 454 fuel cell passenger cars.
In December, another 81,218 electric vehicles were newly registered, only slightly fewer than in the exceptionally strong month of the previous year. While battery-powered electric cars increased by 11 percent in the last month of last year, plug-in hybrids recorded a 16 percent decline.
Reinhard Zirpel, President of the Association of International Motor Vehicle Manufacturers (VDIK), emphasized: “2021 was a record year for alternative drives. Electric cars in particular have achieved a market breakthrough. Now it is important to continue this positive trend. In the new year, we expect new registrations of pure electric cars and plug-in hybrids to total around 850,000 units. The alternative drives as a whole are expected to reach a share of the total market of more than 50 percent in 2022.”
The VDIK regularly updates the list of electric vehicles from international manufacturers. The VDIK member companies currently offer around 140 electric models (including passenger cars and commercial vehicles) that customers can order in Germany. The VDIK electric list can be accessed here.
The demand for vehicles with alternative drives increased significantly overall in 2021. There were million new electric cars, hybrids with and without plugs, mild hybrids and gas passenger cars registered. That’s an increase of 53 percent.
In the overall passenger car market, the balance is shifting toward alternative drive systems. In 2021, they accounted for 43 percent of the total market. Pure gasoline engines accounted for 37 percent, and pure diesels for 20 percent.
| December | January-December | |||||
|---|---|---|---|---|---|---|
| +/- (%) | +/- (%) | Share of total car market | ||||
| BEV | 48,436 | 11 | 355,961 | 83 | ||
| PHEV including: |
32,752 | -16 | 325,449 | 62 | ||
| PHEV – Petrol | 30,219 | -11 | 301,856 | 70 | ||
| PHEV – Diesel | 2,532 | -50 | 23,581 | 5 | ||
| FCEV | 30 | 36 | 454 | 47 | ||
| Electric Vehicles (total) | 81,218 | -2 | 681,864 | 73 | 26 | |
| HEV including: |
36,186 | -14 | 429,139 | 31 | ||
| HEV – Petrol | 25,979 | -8 | 285,898 | 30 | ||
| HEV – Diesel | 10,206 | -26 | 143,234 | 34 | ||
| CNG | 306 | -3 | 3,916 | -45 | ||
| LPG | 1,649 | 17 | 10,118 | 55 | ||
| Alternative Drivetrains (total) | 119,359 | -6 | 1,125,037 | 53 | 43 | |
| Petrol | 72,619 | -38 | 972,588 | -29 | 37 | |
| Diesel | 35,646 | -47 | 524,446 | -36 | 20 | |