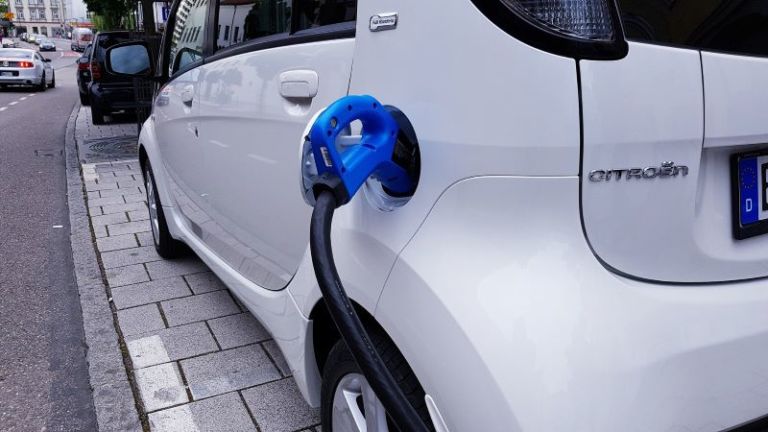
Market decline in July also hits alternative drive systems

Demand for vehicles with alternative drive systems fell by 6 percent in July. On a cumulative basis, alternative powertrains remain up 0.4 percent, with battery electric vehicles and non-plug-in hybrids in particular contributing to this development with growth of 13 and 3 percent respectively. These two types of drive account for almost three quarters of all new registrations with alternative drive systems.
In the months January to July, nearly 639,000 new electric cars, hybrids with and without plugs, mild hybrids and gas-powered passenger cars were registered, or 44 percent of all new registrations. At 269,500 new registrations, hybrids without plug-in drive represent the largest volume. Battery-electric passenger cars follow with over 196,000 registrations. In addition, just under 163,000 plug-in passenger cars were newly registered. With an increase of 96 percent, passenger cars powered by liquid gas recorded the strongest growth, although the volume is low at just over 9,000.
In July, 28,815 new battery-electric passenger cars hit the roads, an increase of 13 percent. Plug-in hybrids were down 21 percent, while the drop for non-plug-in hybrids was 9 percent.
Reinhard Zirpel, President of the Association of International Motor Vehicle Manufacturers (VDIK), emphasized: “Passenger cars with an alternative drive system have so far presented themselves significantly better than the overall market, even if the general market development left its mark.”
The VDIK regularly updates the list of electric vehicles from international manufacturers. The VDIK member companies currently offer around 180 electric models (passenger cars and commercial vehicles) that customers can order in Germany. The VDIK electric list can be accessed here.
In the overall passenger car market, the weighting continues to shift in the direction of alternative drive systems. In the first seven months of the year, they accounted for 44 percent of the total market. Gasoline engines accounted for 36 percent. Only one in five new cars is a diesel (20 percent).
| July | January-July | ||||||
|---|---|---|---|---|---|---|---|
| Change vs. 2021 (%) |
Change vs. 2021 (%) |
Share of total car market |
Market share VDIK (%) |
||||
| BEV | 28,815 | 13 | 196,115 | 13 | 14 | 43 | |
| PHEV | 23,712 | -21 | 162,612 | -16 | 11 | 42 | |
| FCEV | 52 | 37 | 292 | 13 | 0 | 100 | |
| Electric Vehicles (total) | 52,579 | -6 | 359,019 | -2 | 25 | 43 | |
| HEV including: |
36,250 | -9 | 269,488 | 3 | 19 | 44 | |
| full hybrid | 5,628 | 42,143 | 3 | 96 | |||
| mild hybrid | 30,622 | 227,345 | 16 | 34 | |||
| CNG | 195 | -32 | 1,164 | -59 | 0 | 68 | |
| LPG | 1,401 | 44 | 9,042 | 96 | 1 | 99 | |
| Alternative Drivetrains (total) | 90,425 | -6 | 638,713 | 0 | 44 | 44 | |
| Petrol | 74,094 | -20 | 517,746 | -18 | 36 | 31 | |
| Diesel | 41,386 | -11 | 287,423 | -20 | 20 | 40 | |
| for information: | |||||||
| Passenger car (total) | 205,911 | -13 | 1,443,886 | -11 | 40 | ||