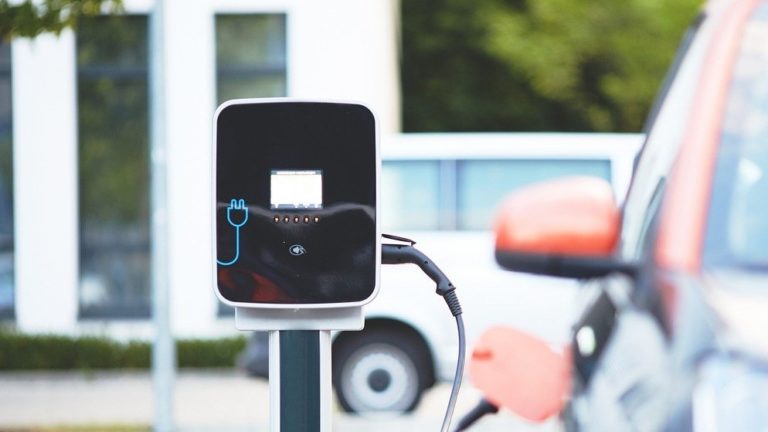
Slight growth in alternative drive systems in August

Like the market as a whole, new registrations of alternative drive vehicles increased by around 3 percent in August. In the first eight months of this year, about 1 percent more new electric cars, hybrids with and without plugs, mild hybrids and gas-powered passenger cars were registered, totaling more than 732,000 vehicles. This brings the alternative powertrains’ market share to 45 percent.
In August, 32,006 new battery-electric passenger cars hit the roads, an increase of 11 percent. Plug-in hybrids recorded 24,719 new registrations (up 1 percent). More than 228,000 battery-electric passenger cars have been newly registered since the beginning of the year (up 12 percent). In addition, more than 187,000 plug-in hybrids were newly registered (down 14 percent).
In addition, 35,116 new hybrids without plugs hit the roads in August (down 3 percent). This corresponds to almost one-fifth of all new passenger car registrations. Among the hybrids, 4,791 were full hybrids, 96 percent of which came from VDIK brands.
The highest growth rates in the first eight months of the year were recorded in August by fuel cell cars (plus 99 percent). All of these 607 new hydrogen passenger cars came from international brands. Passenger cars powered by liquefied petroleum gas also showed strong growth, namely to 10,130 new registrations since the beginning of this year (plus 91 percent).
The VDIK regularly updates the list of electric vehicles from international manufacturers. The VDIK member companies currently offer around 180 electric models (passenger cars and commercial vehicles) that customers can order in Germany. The VDIK electric list can be accessed here.
In the overall passenger car market, the weighting continues to shift in the direction of alternative drives. In the first eight months of this year, they accounted for 45 percent of the total market. Gasoline engines accounted for 35 percent and diesel for 20 percent.
| August | January – August | ||||||
|---|---|---|---|---|---|---|---|
| Change vs. 2021 (%) |
Change vs. 2021 (%) |
Share of total car market |
Market share VDIK (%) |
||||
| BEV | 32,006 | 11 | 228,084 | 12 | 14 | 42 | |
| PHEV | 24,719 | 1 | 187,311 | -14 | 11 | 42 | |
| FCEV | 315 | 570 | 607 | 99 | 0 | 100 | |
| Electric Vehicles (total) | 57,040 | 7 | 416,002 | -1 | 25 | 42 | |
| HEV including: |
35,116 | -3 | 304,606 | 3 | 19 | 44 | |
| full hybrid | 4,791 | 46,934 | 3 | 96 | |||
| mild hybrid | 30,325 | 257,672 | 16 | 34 | |||
| CNG | 160 | -20 | 1,324 | -57 | 0 | 69 | |
| LPG | 1,088 | 53 | 10,130 | 91 | 1 | 100 | |
| Alternative Drivetrains (total) | 93,404 | 3 | 732,062 | 1 | 45 | 44 | |
| Petrol | 69,441 | 1 | 587,187 | -16 | 35 | 40 | |
| Diesel | 36,332 | 6 | 323,755 | -18 | 20 | 31 | |
| for information: | |||||||
| Passenger car (total) | 199,183 | 3 | 1,643,069 | -10 | 40 | ||